
Miami Real Estate Market 2026: Prices, Sales and Inventory
Miami houses and condos tell different market stories. Understand prices, negotiating conditions and ownership costs before making an offer.

5.10.2026

33 minutes

October 5, 2026
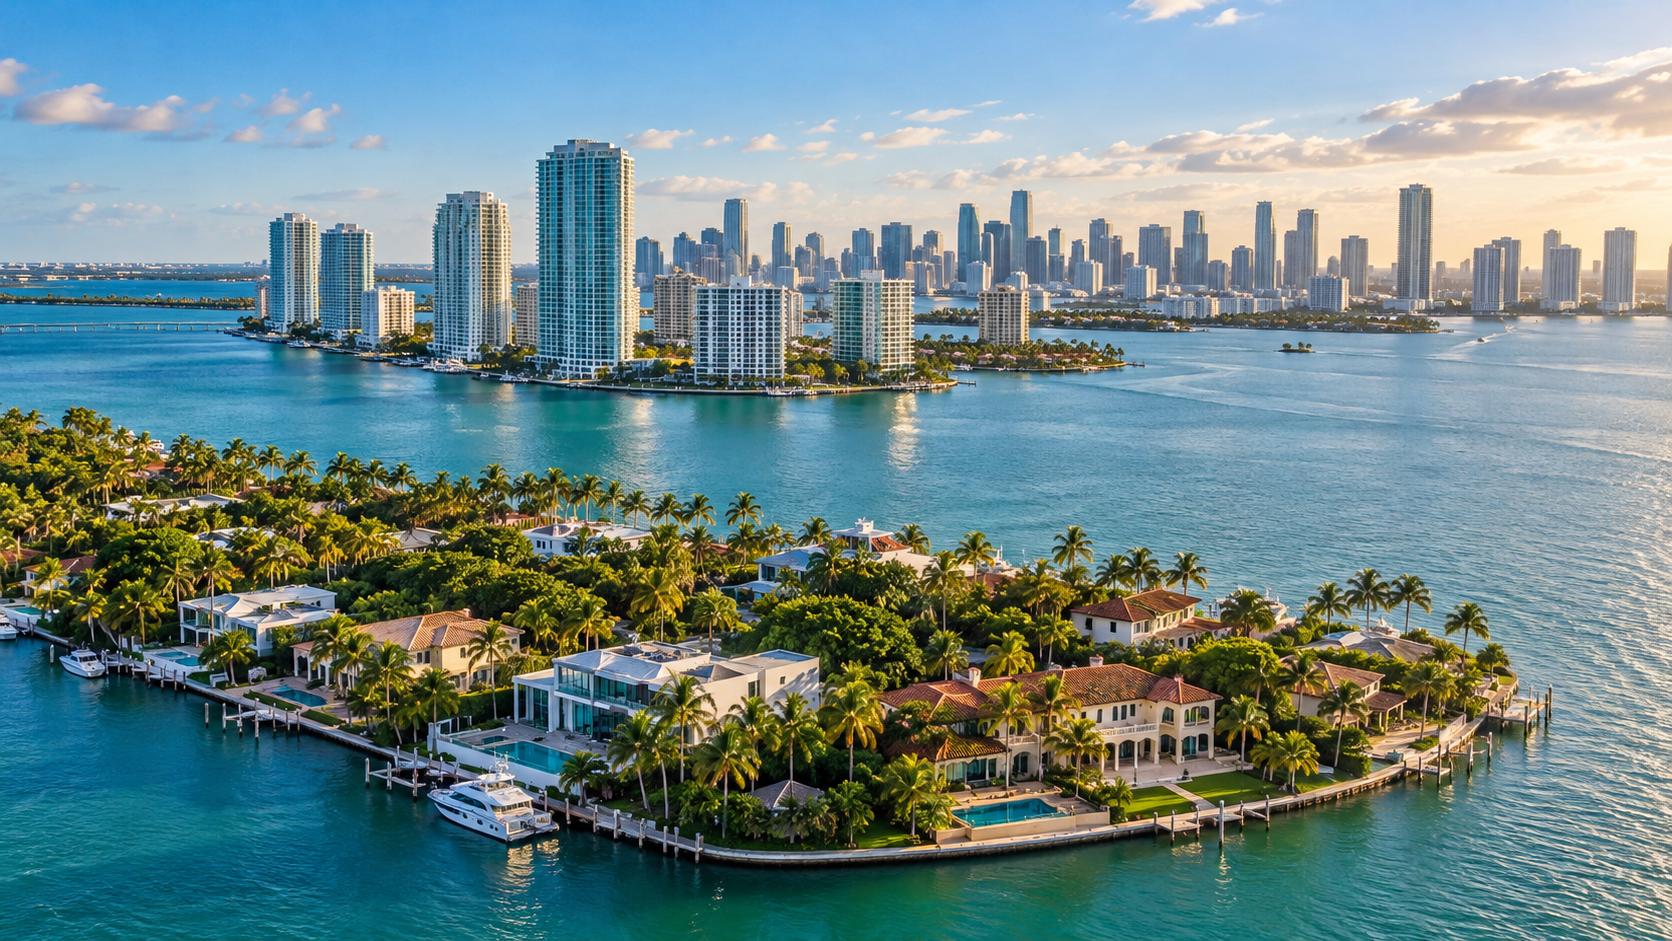
Houses and Condos Require Different Market Decisions
The Miami real estate market has two distinct resale segments in 2026. For Miami-Dade County, not the City of Miami, August single-family homes recorded a $680,000 median sale price and 4.9 months of supply; existing condos recorded $408,000 and 12.1 months. As of October 1, 2026, August is the latest complete MIAMI REALTORS monthly report covered here. Total sales fell 1.1% year over year after 11 consecutive monthly increases.
At Bonadomus, our starting point for a property decision is its relevant comparison group. A countywide headline cannot establish the value of a house on a particular street or a condominium in a particular building. Combining those markets obscures differences in financing, ownership costs, condition and negotiating leverage.
This overview moves from sales, prices and inventory to the factors that determine whether a transaction makes sense: borrowing costs, building documents, insurance, flood exposure and taxes after purchase. Luxury activity and new construction receive separate treatment because neither fits neatly into the typical resale transaction.
The figures below are historical observations, not price forecasts or investment-return promises. September data and subsequent mortgage-rate releases should be checked before relying on this October 1 snapshot. Any purchase or listing decision also requires current comparable sales and verification of the exact property's condition, costs and restrictions.
August 2026 Snapshot: Sales, Prices and Supply
Miami-Dade recorded 1,769 residential closed sales in August 2026, down 1.1% year over year, while active inventory totaled 15,825 listings, down 12.1%. Single-family prices increased year over year and existing-condo prices were nearly flat. Cash accounted for 37.8% of all residential closings.
| Indicator | Single-family homes | Existing condominiums |
|---|---|---|
| Closed sales | 858 | 911 |
| Sales change, year over year | -3.1% | +1.0% |
| Median closed sale price | $680,000 | $408,000 |
| Median price change, year over year | +3.82% | -0.49% |
| Active listings | 4,330 | 11,495 |
| Inventory change, year over year | -19.23% | -9.04% |
| Months of supply | 4.9 | 12.1 |
| Median days to contract | 40 | 66 |
| Median days to sale | 80 | 108 |
| Median original list price received | 95% | 94% |
| Cash share of closings | 24.2% | 50.5% |
Source: MIAMI REALTORS + RWorld, August 2026 Miami-Dade report, released September 16, 2026. Year-over-year comparisons use August 2025; inventory represents active listings at month-end. These figures largely exclude developer transactions outside the resale MLS.
- Distressed transactions: foreclosures and short sales represented 0.3% of August residential closings.
- High-end activity: 194 sales at $10 million or more closed through August, compared with 170 during all of 2025.
- Financing benchmark: Freddie Mac reported a national 30-year fixed average of 7.28% on October 1, 2026. This is not a Miami borrower quote.
The table supports a segmented reading of the Miami housing market. It does not establish an offer discount, predict a property's selling time or replace an appraisal. The September monthly report should be checked when available.
In this market review
- Geography, reporting dates and sales momentum
- Prices, inventory and negotiating conditions
- Cash purchases, mortgages and luxury activity
- New construction and condominium due diligence
- Flood exposure, insurance and property taxes
- Buyer and seller priorities and property-specific analysis
What the Miami-Dade Figures Actually Cover
The monthly statistics discussed here describe Miami-Dade County MLS activity, rather than the City of Miami alone. Their reporting period is August 2026, with an October 1 information cutoff. Comparing another geography or month without labeling the difference can produce a misleading market narrative.
County, City and Neighborhood Are Different Comparison Groups
Miami-Dade County includes the City of Miami, Miami Beach, Coral Gables, Hialeah, Homestead and numerous other municipalities and unincorporated areas. U.S. Census Bureau QuickFacts for Miami-Dade County estimates 2,802,029 residents on July 1, 2025, and reports 1,125,274 housing units. That scale helps explain why one county median encompasses very different properties.
South Florida housing market summaries may also include Broward and Palm Beach counties. Their inventory, property mix and price changes should not be substituted for Miami-Dade figures. A ZIP code can offer a narrower comparison, but it may still contain multiple neighborhoods and building types.
For example, evaluating Brickell real estate requires attention to individual towers, association finances and unit characteristics. A countywide condominium median provides context; comparable units in the same building or genuinely competing buildings provide more useful pricing evidence.
Likewise, a search for Miami Beach real estate crosses several distinct property categories. We separate houses from condos, then refine comparisons by location, size, condition and documented amenities. That approach keeps broad market statistics from becoming an unsupported valuation.
Why Closed-Sales Reports Arrive Later
The August report was released September 16, 2026. Monthly reporting requires completed transactions to be collected and processed, so a new calendar month does not immediately produce a complete closed-sales dataset. September results should not be inferred from August closings or current listing activity.
Closings also lag buyer decisions. Many transactions close one to three months after contract signing, although cash purchases, financing complications and other circumstances can change that interval. August sales therefore reflect earlier negotiations and borrowing conditions, rather than only what buyers experienced in August.
We keep report dates alongside the figures because a current mortgage benchmark and an earlier closing report answer different questions. The former describes a financing environment; the latter records completed purchases. Pending contracts, new listings and showing activity can add context, but they should remain separately labeled.
Miami Home Sales Paused After 11 Months of Growth
Miami-Dade closed 1,769 residential sales in August 2026, a 1.1% year-over-year decline that ended 11 consecutive months of increases. Single-family sales fell 3.1% to 858, while Miami condo sales increased approximately 1% to 911 from 903. One negative month does not establish a sustained reversal.
The preceding reports give August useful context. By May, total sales had increased year over year for nine consecutive months. MIAMI REALTORS described June as the strongest June for sales in three years and the tenth consecutive increase; July extended the sequence to eleven.
August interrupted that run, but the two segments did not move together. Existing-condo closings increased slightly even with considerably more supply relative to sales. Single-family closings declined while the median sale price rose, illustrating why transaction volume and pricing must be interpreted separately.
Higher mortgage rates are a plausible constraint on financed demand, although the monthly totals cannot isolate their effect. A household may reduce its budget, delay an offer or change property type when financing becomes more expensive. The resulting effect can appear in closed-sale statistics weeks or months later.
In our transaction support, we distinguish inquiries, showings, offers, contracts and closings. Each represents a different level of commitment. Without a documented company activity series, we would not turn impressions about summer showing traffic into a claim about countywide demand.
Distressed sales represented just 0.3% of August closings, according to MIAMI REALTORS + RWorld. That indicates foreclosures and short sales were a very small component of completed transactions. It does not establish that every owner has comfortable finances or that assessment-related selling pressure is absent.
The practical next step is to watch several releases together. September and October sales, pending activity and new-listing trends can help determine whether August was a temporary interruption or part of a broader slowdown. Until then, a property's competing inventory provides more actionable evidence than a sweeping market label.
Miami Housing Prices Diverged Between Houses and Condos
August 2026 Miami-Dade single-family prices rose 3.82% year over year to a $680,000 median, while the existing-condo median declined 0.49% to $408,000. A blended Miami median home price hides that difference. Medians describe the transactions that closed, rather than the value change of a particular property.
Single-Family Home Prices and the Summer Pattern
The August single-family median increased from $655,000 a year earlier. Within 2026, the reported median was $680,000 in May, $695,000 in June and $680,000 in August. June was higher than those comparison months, but that does not prove every house gained and subsequently lost value.
The mix of transactions matters. A month with more large, renovated or waterfront properties can produce a higher median even when comparable-property values change little. Seasonal shifts can also influence the mix; determining their contribution requires more than three monthly observations.
For clients comparing Miami Beach homes, relevant evidence includes recent nearby closings, lot characteristics, permitted improvements, roof condition and verified waterfront features. Countywide price movement provides a starting point for discussion, not a percentage adjustment to every listing.
Supply remains an important support for seller leverage: August single-family inventory represented 4.9 months of supply. However, only 24.2% of closings were cash, so mortgage affordability matters to a substantial portion of this segment. A well-supported asking price must still fit the purchasing power of likely buyers.
Miami Condo Prices Depend on the Building
The existing-condo median moved from $410,000 in August 2025 to $408,000 in August 2026. May 2026's median was $415,000. Those figures describe modest changes in the countywide transaction mix while leaving considerable room for different results across individual buildings.
We disagree with pricing a condo directly from the county median. Association reserves, structural work, insurance, assessments and lender eligibility can materially affect what a buyer is willing and able to pay. A renovated interior does not answer questions about the building's financial obligations.
When evaluating Miami Beach condos, compare recent closed sales alongside their assessment arrangements and known building conditions. Two apparently similar units may have different costs because one seller paid an assessment before closing or because one transaction occurred before a major repair obligation became known.
Newer construction is not an automatic substitute for document review. Older buildings can have completed significant work and accumulated reserves; newer associations can still face insurance changes, operating deficits or warranty issues. The useful distinction is documented condition and financial readiness, rather than age alone.
For Miami home prices in 2026, the most defensible conclusion remains property-type-specific: houses recorded a higher annual median, and existing condos recorded a nearly flat one. Neither result provides a forecast for the next purchase or sale.
Miami Housing Inventory Fell Annually but Increased from July
Miami-Dade had 15,825 active residential listings at the end of August 2026, down 12.1% year over year but above July's 15,599. Single-family inventory totaled 4,330 listings and 4.9 months of supply; existing condos totaled 11,495 listings and 12.1 months. Lower annual inventory therefore coexisted with a small monthly increase.
| Month | House listings | Condo listings | House supply | Condo supply |
|---|---|---|---|---|
| June | 4,380 | 11,550 | 4.9 months | 12.3 months |
| July | 4,275 | 11,324 | 4.8 months | 12.0 months |
| August | 4,330 | 11,495 | 4.9 months | 12.1 months |
Source: MIAMI REALTORS + RWorld monthly Miami-Dade reports for June, July and August 2026. The summer sequence shows relatively similar supply conditions across these months, with a persistent difference between property types.
Months of supply relates active inventory to a monthly sales pace. Published reports may use a smoothed sales pace, so dividing month-end listings by that month's closings may not reproduce the reported figure. MIAMI REALTORS treats six to nine months as balanced.
August single-family inventory was down 19.23% year over year; existing-condo inventory was down 9.04%. Nevertheless, condo listings outnumbered house listings by more than 2.5 to one. Falling inventory alone therefore does not establish a tight condo market.
Alternative property searches also require careful classification. Buyers comparing South Florida townhouses should verify both geography and ownership structure before applying these county figures. Architectural appearance does not establish whether a property is governed as a condominium or another ownership form.
Developer inventory outside the resale MLS adds another limitation. The reported condo total does not measure every unit competing for buyers, and future deliveries represent a different category from homes available for immediate occupancy. We examine those sources separately rather than adding an unsupported pipeline estimate to active listings.
Why Houses and Existing Condos Operate at Different Speeds
Single-family homes were tighter than MIAMI REALTORS' balanced-market range at 4.9 months of supply, while existing condos were looser at 12.1 months. Those differences support greater seller leverage for houses and greater buyer choice in many condo searches. Neither label applies automatically to every neighborhood, price band or building.
| August 2026 factor | Single-family homes | Existing condos |
|---|---|---|
| Supply position | Below the balanced range | Above the balanced range |
| Annual median price direction | Up 3.82% | Down 0.49% |
| Median time to contract | 40 days | 66 days |
| Cash share | 24.2% | 50.5% |
| Key property-level exposures | Condition, insurance, flood, financing | Shared repairs, reserves, assessments, project financing |
Limited opportunities for new detached housing in established locations constrain the alternatives available to some house buyers. Condominium supply follows different development patterns, and owners share responsibility for building systems. Repairs and reserve funding can therefore affect many units simultaneously.
Post-Surfside safety requirements add another layer to condo comparisons. An association's inspection findings, funding plan and insurance arrangements can influence monthly dues and future assessments. The same information can also determine whether a lender accepts the project.
Consider two illustrative searches, rather than reported client transactions. A house buyer might find few comparable properties within a narrowly defined location and condition requirement, while a condo buyer might find several substitutes in one building. The first buyer may prioritize speed and financing readiness; the second may have room to negotiate after completing document review.
A townhouse search can fall between these practical experiences. For Miami Beach townhouses, we would verify maintenance responsibilities, association rules and legal ownership before choosing comparables or applying a financing strategy. Shared walls alone do not establish how reserves or insurance work.
The most useful question is how many credible alternatives compete with the exact property. County months of inventory frame that question, but the answer comes from the relevant shortlist and recent transactions.
Days on Market Show Different Selling Conditions
August single-family closings recorded median times of 40 days to contract and 80 days to sale, compared with 66 and 108 days for existing condos. Median original list price received was 95% for houses and 94% for condos. These figures show negotiation and marketing time within both segments, without prescribing a discount for any listing.
Time to contract measures the interval between listing and an accepted contract under the reporting methodology. Time to sale extends through closing. Financing, title work, inspections and association requirements can affect the latter interval.
Subtracting these two medians does not establish the median contract-to-closing period. Each statistic summarizes a distribution, and the midpoint transactions need not be the same. Buyers should use their contract and lender's timeline to plan an actual closing.
The original-list-price ratio compares a closing price with the initial asking price, capturing the effect of intervening reductions. A final-list-price ratio answers a different question. A property can close close to its last advertised price after substantial earlier cuts.
The reported 95% and 94% figures correspond to gaps of roughly 5% and 6% from original asking prices at the median. They do not mean every seller will accept that reduction. They also do not isolate seller credits, condition adjustments or other economic terms unless the underlying methodology expressly includes them.
For seller advice, we examine pricing history, competing listings and comparable closings together. For buyer advice, we consider whether a listing has credible substitutes and whether its condition or documents explain its market time. Long exposure can reflect overpricing, a limited buyer pool or a specific unresolved issue.
A stale listing in the same condo building can be more informative than the county median, particularly if its layout and carrying costs closely match the subject unit. We still verify whether it remains genuinely available and whether its asking price has changed before treating it as negotiating evidence.
Cash Purchases and Mortgage Rates Affect Demand Unevenly
Cash represented 37.8% of Miami-Dade residential closings in August 2026, including 50.5% of existing-condo sales and 24.2% of single-family sales. Freddie Mac's national 30-year fixed benchmark reached 7.28% on October 1. The larger financed share of house purchases makes borrowing costs especially relevant to that segment.
Cash Buyers and Condo Project Review
A cash closing identifies how the transaction was funded, not the buyer's motivation or background. Cash can appear in primary-home, second-home and investment purchases. The August percentages do not establish how much activity came from any one of those groups.
Project eligibility can also influence financing availability for condos. A buyer may qualify personally while the building fails a lender's review. Cash removes the mortgage approval requirement, but it does not remove exposure to repairs, assessments, insurance gaps or resale limitations.
For financed purchases, lenders may examine association budgets, reserves, insurance, litigation, critical repairs and applicable inspection information. Occupancy and ownership concentration can also matter depending on the program. Requirements differ across conventional, jumbo and portfolio products.
Our role in financing coordination is to surface property information early enough for the lender to assess it. A general preapproval does not guarantee that a particular condominium is eligible. Waiting until late in the transaction to submit association documents can leave both parties with avoidable uncertainty.
Investors considering Miami multi-family properties need a separate financing and operating analysis. Unit count, rental documentation and loan structure can change underwriting, while the house and condo medians in this article do not establish multifamily value or income.
Mortgage Rates and Purchasing Power
Freddie Mac's supplied 2026 PMMS series shows the national 30-year fixed average at 5.98% on February 26, 6.71% on September 3, 6.76% on September 10, 6.95% on September 17, 7.03% on September 24 and 7.28% on October 1. The change from late February to October 1 was 1.30 percentage points.
These are national conventional conforming benchmarks, not quotes for an individual Miami borrower. Credit, loan size, occupancy, points, loan-to-value ratio and property eligibility can change actual pricing. Jumbo and investment-property loans may follow different terms.
For an illustrative $680,000 purchase with 20% down, the loan principal would be $544,000. On a fully amortizing 30-year fixed loan, principal and interest would be approximately $3,255 monthly at 5.98% and $3,722 at 7.28%, a difference of about $467. This is a mathematical comparison, not a lender offer.
The example excludes taxes, insurance, association dues, assessments, closing costs and any mortgage insurance applicable under different terms. It also assumes the same principal and repayment period at both rates. Buyers should compare lender quotes on the same day and with the same points and fee assumptions.
We favor an affordability ceiling based on verified total monthly costs. A purchase that depends on an assumed future refinance carries additional uncertainty because future rates, property value and borrower eligibility are unknown.
Luxury and $10 Million Sales Follow a Separate Pattern
Miami-Dade recorded 194 residential sales at $10 million or more through August 2026, according to MIAMI REALTORS + RWorld. That exceeded the county's full-year 2025 total of 170 by 14.1%. Strong activity at this price level does not establish comparable liquidity elsewhere in the market.
The association's first-half 2026 report defined luxury as the top 5% of closed sales. The entry thresholds were $4.3 million for single-family homes and $3.4 million for condominiums. For the top 1%, described as ultra-luxury, thresholds were $15 million and $10 million respectively.
These are distribution-based thresholds for a stated period, rather than permanent definitions. They differ from marketing labels attached to listings. A property advertised as luxury does not necessarily fall within the report's top-5% group.
High-end demand can respond to factors such as relocation, available wealth, waterfront characteristics and the scarcity of close substitutes. Cash purchasing can reduce direct sensitivity to mortgage rates. However, the supplied figures do not quantify the contribution of each factor to the 194 transactions.
Large transactions have a direct effect on dollar volume and can affect average sale prices. Their effect on a median is different because the median identifies the middle transaction. A record luxury headline therefore cannot be translated into a broad increase in typical home values.
For a high-end property, we examine the competing inventory at a similarly specific level. Waterfront access, lot configuration, construction quality, documented improvements and building services can materially narrow the comparison set. A unique property may also have fewer comparable sales, increasing valuation uncertainty.
Luxury strength is useful context for that segment. It does not remove the need to verify ownership costs or support a promise about appreciation, resale timing or future demand.
New Construction Extends Beyond the Resale MLS Totals
Standard resale MLS statistics largely omit new-construction, pre-construction and condo-conversion transactions handled outside the MLS. Miami-Dade monthly sales and inventory therefore do not measure the entire development market. Some developer listings may appear, so the distinction concerns coverage rather than a universal exclusion.
U.S. Census Bureau QuickFacts reports 16,535 building permits in Miami-Dade County for 2025. That provides construction context, not a count of completed homes or units available for purchase today. Permitted housing can reach the market on different schedules, and a permit does not guarantee completion.
Future condo deliveries can create competition for resales, but pipeline units should not be treated as interchangeable with current listings. Timing, contract commitments, cancellation provisions and intended use affect whether units actually become available. A reliable supply comparison identifies these categories separately.
When comparing developer inventory with resale options, we focus on the complete financial commitment:
- Contract price, deposit schedule and the treatment of deposits under the agreement.
- Delivery provisions, permitted extensions and remedies that require legal review.
- Documented specifications, included finishes and potential upgrade costs.
- Estimated association budget, insurance arrangements and reserve obligations.
- Financing availability at closing and the consequences of changing borrowing conditions.
Price per square foot can help only when measurement conventions and included areas are comparable. A pre-construction contract signed years before delivery also belongs to a different pricing context from a recently closed resale. We avoid presenting the difference as immediate equity or a guaranteed discount.
Taxes deserve separate attention because a contract price may differ from market value on the applicable January 1 assessment date. Developer estimates, delivery schedules and operating budgets remain subject to verification and change. Buyers should have qualified legal and financial professionals review the actual agreement before committing funds.
Condo Value Depends on Reserves, Inspections and Financing Eligibility
The Miami condo market in 2026 requires building-level review of structural integrity reserve studies, milestone inspections, recertification and association finances. Florida Statutes §553.899 addresses milestone inspections, §718.112 addresses condominium governance and reserves, and §718.503 addresses purchase disclosures. Applicability and current compliance must be verified for the particular building.
SIRS, Reserves and Special Assessments
A structural integrity reserve study, or SIRS, evaluates specified building components and their funding needs. Depending on statutory applicability, these include structural systems, roofs, fireproofing and fire protection, plumbing, electrical systems, waterproofing, windows and other qualifying items. A study's findings need to be read alongside its assumptions, component scope and funding schedule.
The Florida condominium reserve framework restricts the ability to waive or underfund required structural reserves, subject to applicable statutory provisions. Owners should not assume that historical reserve-waiver practices remain available. Compliance dates, permitted funding methods and exceptions require current professional review.
A funding shortfall can lead to higher regular assessments, special assessments or other legally permitted financing arrangements. These obligations affect affordability even when the purchase price appears competitive. An association loan can spread payments over time while still creating an obligation owners must fund.
Our evaluation framework connects the study to the budget: what work is identified, when it is expected, what reserves exist and how the remaining amount will be funded. A completed study is evidence of analysis; it is not proof that recommended work has been completed or fully funded.
Milestone Inspections and Local Recertification
State milestone inspections apply to qualifying condominium and cooperative buildings under §553.899. Miami-Dade also operates a local recertification program that can involve structural and electrical review. The programs have different legal foundations, and a buyer should verify which requirements apply and what the responsible authority has accepted.
The phrase "Miami 40 year recertification" remains common, but relying on that name can misstate current timing. County guidance describes applicable recertification schedules at 30 years for inland buildings and 25 years for qualifying coastal buildings, followed by ten-year intervals. Building characteristics, location and program applicability require confirmation.
Jurisdiction matters. Municipalities such as Miami Beach administer building matters within their boundaries, while county processes apply within their relevant jurisdiction. A county registry entry alone should not be treated as conclusive evidence that every municipal requirement has been satisfied.
Use the County RER Records Search and Community Association Registry alongside the responsible building department's records. Review reports, notices, required repairs and acceptance documentation. An inspection date, an engineer's recommendation and a closed recertification file are different stages.
Documents to Review Before Committing
Document collection should start early enough to inform the offer and the contractual review process. Section 718.503 provides relevant condominium disclosure requirements; an attorney should confirm the applicable documents, timing and cancellation rights. Do not assume every contract offers the same review period.
- SIRS and reserve schedules: scope, funding assumptions, balances and planned contributions.
- Inspection records: milestone findings, recertification status and unresolved repair requirements.
- Assessments: adopted charges, proposed work, payment schedules and responsibility at closing.
- Insurance: master coverage, exclusions, deductibles and renewal information.
- Association finances: current budget, financial statements, delinquencies and outstanding loans.
- Legal and lending issues: litigation, project eligibility and lender-required documentation.
- Board minutes: preferably the last 12 to 24 months, subject to availability and applicable access rights.
Minutes can reveal repair discussions or potential assessments before a final amount enters the budget. They do not establish that a discussed charge has been adopted. We use those distinctions to identify questions for the association, attorney, engineer and lender rather than treating preliminary discussion as a confirmed liability.
Flood Exposure and Insurance Require Parcel-Level Checks
Miami-Dade ownership costs depend on the exact parcel, building and coverage terms. FEMA flood-zone designation, homeowners insurance, wind coverage, association dues and assessments all affect affordability. Flood insurance is generally required for federally backed mortgages secured by buildings in Special Flood Hazard Areas, and lenders may impose additional requirements.
Start with the county's published FEMA flood-zone maps and match the address and parcel carefully. A Miami flood zone map search should lead to the property's actual designation, rather than a conclusion based on the neighborhood's name. Request an elevation certificate where available and discuss its relevance with the insurer.
A location outside a Special Flood Hazard Area does not establish zero flood risk. Mapped zones, elevation, drainage and coverage exclusions answer different questions. An insurance professional can explain available coverage and limitations without turning a map designation into a safety guarantee.
Homeowners and wind premiums vary with roof age, construction, mitigation features, location, coverage limits and carrier underwriting. Obtain property-specific quotes while contractual protections still allow informed review. A seller's premium may not transfer to a new owner or reflect currently available terms.
| Cost item | Verification source |
|---|---|
| Mortgage payment | Property-specific lender quote and loan disclosures |
| Post-purchase property tax | County estimator and exemption review |
| Homeowners and wind insurance | Written insurance quotes and coverage terms |
| Flood insurance | Flood determination, insurer and lender |
| Association dues | Current adopted budget and assessment schedule |
| Special assessments | Association notices and closing allocation |
| Maintenance | Inspection findings and property-specific estimates |
For condos, master-policy premiums may already be included in association dues, while the owner still needs appropriate unit coverage. Avoid double-counting the same expense, but verify deductibles and exposures that remain with owners. The resulting worksheet is more useful than applying a generic ownership-cost percentage.
A Seller's Tax Bill May Understate the Buyer's Future Taxes
A Miami-Dade property tax bill reflects the current owner's assessment history and exemptions, which may change after a sale. The Property Appraiser warns that a transfer can remove a seller's Save Our Homes assessment cap and lead to reassessment at market value for the following tax year. Buyers should estimate their own circumstances rather than carry forward the seller's bill.
Long-term ownership can create a substantial difference between assessed value and market value. Homestead exemptions and applicable assessment limitations affect the existing owner's taxes. Eligibility for exemptions, portability and other treatment depends on the buyer's circumstances and statutory requirements.
The official Miami-Dade Property Appraiser Tax Estimator provides a more appropriate starting point than a universal tax percentage. Its result remains an estimate. Buyers should verify assumptions, taxing jurisdictions, exemptions and any non-ad valorem charges that affect the final bill.
Consider an illustrative budgeting error: a buyer uses the seller's longstanding homestead tax bill to calculate a monthly payment. After replacing it with an estimate reflecting the purchase and the buyer's eligibility, the ownership budget changes. No change in the contract price is necessary for that affordability difference to arise.
Pre-construction requires an additional check. A contract signed earlier may have a price different from market value on the January 1 assessment date. A tax bill associated with land or partially completed construction should not be treated as the ongoing bill for a completed residence.
Recording taxes are separate from annual property taxes. Miami-Dade Clerk guidance states a documentary stamp tax of $0.60 per $100 of consideration on deeds, with a $0.45 per $100 surtax on transfers of property other than a single-family residence, subject to applicable treatment and exemptions. Mortgage-related taxes may also apply when financing documents are recorded.
The closing agent or attorney should calculate applicable charges and explain their allocation under the contract. For planning purposes, keep three categories separate: annual ownership taxes, prorations at closing and one-time recording or transfer costs. Combining them can obscure both the cash needed to close and the ongoing monthly expense.
Long-Term Price Growth Does Not Predict the Next Sale
MIAMI REALTORS reports that Miami-Dade's single-family median increased from $172,700 in 2011 to $680,000 in August 2026, while the condo median increased from $113,800 to $408,000. These are nominal transaction medians. They are neither inflation-adjusted investment returns nor evidence that a particular property appreciated by the same amount.
The endpoints also compare an annual historical figure with a specific month. Changes in housing stock, transaction mix, renovations and location preferences can influence medians over time. Calculating an owner's return would additionally require acquisition costs, financing, taxes, insurance, maintenance, assessments and sale expenses.
Census figures describe another measurement entirely. QuickFacts reports a $463,000 median value for owner-occupied housing and a 52.2% owner-occupancy rate for 2020-2024. These multiyear estimates cannot be read as August 2026 closed-sale statistics or used to infer a recent price decline.
Asset categories also require separate evidence. Investors reviewing South Florida commercial real estate need property-specific operating, lease and valuation analysis. Residential medians do not establish commercial capitalization rates, tenant risk or market rent.
The same boundary applies to businesses for sale in South Florida, where operating assets, liabilities, licenses and lease terms may drive value. A business acquisition may not include ownership of the premises. This residential review should not be used as evidence of business performance.
We do not turn long-term housing appreciation into a forward price prediction. Today's decision depends on current alternatives, borrowing terms and property-level obligations. Historical context helps explain how the market arrived here; it cannot determine the terms of a future sale.
Buyers Should Connect Negotiating Leverage to Verified Costs
Buyers should prioritize segment-specific supply, their actual financing terms and the property's full ownership costs. Houses had relatively limited supply in August, while many condo searches offered more alternatives. Any apparent discount should be evaluated after reviewing taxes, insurance, flood exposure and, where applicable, association documents.
For single-family buyers, 40 median days to contract leaves room for preparation without establishing that every listing will remain available that long. Obtain a meaningful preapproval and compare the asking price with recent neighborhood closings. Condition, roof life and permitted improvements can change the economics of a seemingly similar house.
For condo buyers, 12.1 months of supply and 94% median original list price received indicate broader negotiating possibilities. They do not justify applying a standard 6% reduction to every asking price. A unit with strong documentation and few close substitutes can have different leverage from a building with unresolved work.
- Track reporting dates: distinguish the latest completed sales month from current asking prices.
- Confirm financing: obtain a property-specific quote and understand rate-lock timing and conditions.
- Review the building: obtain relevant inspections, reserve studies, budgets and assessment information.
- Check flood exposure: verify the parcel designation and discuss coverage with the insurer and lender.
- Estimate taxes: model the purchase using the county's estimator and your own exemption eligibility.
- Price insurance: secure written quotes with clear limits, deductibles and exclusions.
A useful comparison worksheet includes both cash needed to close and recurring ownership costs. Add known assessment payments separately, identifying who pays them under the proposed contract. For uncertain repairs, record the uncertainty and the professional estimate still needed instead of inserting an unsupported allowance.
Remote buyers need the same verification standard. Virtual showings can assist selection, but they do not replace inspections, title review or examination of association records. The objective is a purchase supported by evidence that remains understandable after the initial viewing.
Sellers Need Segment-Specific Pricing and Ready Documentation
Sellers should price against direct competition and recent comparable closings, rather than broad Miami real estate trends. Single-family supply remained relatively tight at 4.9 months in August; existing condos faced 12.1 months and a 66-day median to contract. Documentation and realistic pricing matter in both segments.
The single-family median was below June's $695,000 reading, but that movement does not prescribe a reduction for every house. Review the subject property's competitive position first. A current listing with a different lot, condition or insurance profile may be a poor substitute even if it is nearby.
We use the first two weeks as a practical review window for a listing strategy, rather than promising a sale within that period. The useful evidence includes qualified inquiries, showings, competing listings and substantive feedback. Limited response can justify examining price, presentation, access or missing information.
Original-list-price ratios show why the initial asking price deserves attention. August sellers received median ratios of 95% for houses and 94% for condos, but those figures cannot prove that overpricing caused every gap. A listing history and competing-sale review are needed to understand an individual result.
Condo sellers can reduce uncertainty by preparing documents before a buyer requests them:
- Current association budget, dues and available financial statements.
- SIRS, milestone inspection and recertification information applicable to the building.
- Adopted assessments, payment schedules and documented repair plans.
- Insurance information and responses to lender project-review requests.
- Required disclosures and clarification of any unresolved information.
Higher financing costs can affect the pool of financially qualified buyers. Property eligibility and loan requirements matter when evaluating an offer, alongside price, contingencies and closing terms. Cash offers still require verification and do not automatically produce the strongest net outcome.
Rates, Condo Costs and New Supply Could Change Conditions
The next useful indicators are mortgage-rate direction, subsequent monthly sales, segment-specific inventory, condo funding obligations, insurance costs and development deliveries. These variables could change buyer demand or seller competition. They are monitoring priorities, not a forecast of Miami housing prices.
For financed buyers, movement from the October 1 national benchmark of 7.28% could alter purchasing power. The effect depends on actual lender terms and household finances. A lower benchmark would not automatically solve a condo's project-eligibility issue or eliminate its assessment obligations.
September and October closings will help put August's decline into context. We would read them alongside pending contracts and inventory because completed sales reflect earlier decisions. A single month of higher or lower closings cannot explain all the underlying causes.
For condos, watch whether inventory continues to decline year over year and whether building-level funding requirements create new listings or change asking prices. Separate adopted assessments from preliminary estimates. Legislative changes and updated implementation guidance also require review against current official sources.
Insurance renewals can affect both individual homes and association budgets. Premiums are only part of that assessment: deductibles, exclusions and availability of coverage matter too. Buyers and sellers should refresh quotes when the transaction timeline changes substantially.
Development monitoring should distinguish announcements, permits, construction progress, completed units and actual availability. Those stages represent different levels of certainty. Treating all announced units as current inventory can overstate immediate competition, while ignoring developer listings can understate it.
For a property-specific review, we align comparable-sale dates, current competition, lender information and cost documents as closely as possible. That prevents a recent asking price from being judged using stale financing or association assumptions. The next monthly report should update the market backdrop without replacing that detailed work.
Request Analysis Built Around the Exact Property
County medians cannot price a particular home or condominium. Review current Miami real estate listings and request a property-specific market analysis from Bonadomus, with comparable sales, relevant competing inventory and building-level or parcel-level cost considerations.
The analysis should identify neighborhood or building comparables, their dates and condition differences, marketing time and asking-to-closing relationships. For condos, it should also identify the association documents needed for review and any unanswered questions about reserves, inspections, assessments or financing eligibility.
Before making a transaction decision, verify taxes, insurance, flood exposure, condominium documents and financing for the exact property. Bonadomus can coordinate the search and transaction process, while legal, engineering, tax, insurance and lending conclusions remain with the appropriate qualified professionals. The goal is a decision based on current evidence and clearly identified uncertainties.
Use County Trends as Context and Property Evidence for Decisions
Miami-Dade's August 2026 resale figures describe two different market conditions: relatively tight single-family supply with a rising annual median, and more abundant existing-condo supply with a nearly flat median. Total sales paused after 11 months of year-over-year increases. That interruption deserves monitoring rather than an immediate declaration of a sustained reversal.
The central distinction is between context and valuation. County statistics explain the broader environment, while relevant comparable sales and current competition help establish a property's position. City of Miami, Miami-Dade County and wider South Florida figures should remain clearly separated.
For condos, building condition and finances can materially change the meaning of an asking price. SIRS, milestone inspections, local recertification, reserves and assessments need to be read together. Financing eligibility adds another review that a buyer's personal preapproval does not resolve.
For every property type, the ownership budget should reflect post-purchase taxes, actual insurance quotes and parcel-specific flood considerations. A lower purchase price can coexist with higher recurring costs. A higher county median can coexist with limited demand for an individual listing.
This review is dated October 1, 2026, and uses August as its latest complete monthly market period. Check subsequent reports and current lending terms before acting. Historical sales and prices support informed comparisons; they do not guarantee appreciation, rental income, investment returns or the outcome of a future transaction.
What is the median home price in the Miami real estate market in 2026?
In August 2026, Miami-Dade County single-family homes recorded a $680,000 median closed sale price, up 3.82% year over year. Existing condos recorded $408,000, down 0.49%. These MIAMI REALTORS figures cover the whole county, not just the City of Miami. They describe the mix of closed transactions, not the value change of any particular property.
Is Miami a buyer's or seller's market for houses and condos in 2026?
It depends on the segment. Single-family homes had 4.9 months of supply in August 2026, below the 6-9 month range MIAMI REALTORS treats as balanced, which supports seller leverage. Existing condos had 12.1 months of supply and a 66-day median to contract, compared with 40 days for houses, so many condo searches give buyers more choice. Neither label applies automatically to every neighborhood, price band or building.
Why did Miami home sales fall in August 2026?
Miami-Dade closed 1,769 residential sales in August 2026, down 1.1% year over year, ending 11 consecutive months of increases. Single-family sales fell 3.1% to 858, while existing-condo sales rose about 1% to 911. Higher mortgage rates are a plausible constraint on financed demand, but monthly totals cannot isolate their effect. One negative month does not establish a sustained reversal, so September and October reports should be read together.
How do current mortgage rates affect purchasing power in Miami?
Freddie Mac's national 30-year fixed average was 7.28% on October 1, 2026, up from 5.98% on February 26. This is a national benchmark, not a quote for a Miami borrower. On an illustrative $544,000 loan, monthly principal and interest rise from about $3,255 to $3,722, roughly $467 more, before taxes, insurance and association dues. Rates matter most for houses, where only 24.2% of August closings were cash, compared with 50.5% for existing condos.
What should Miami condo buyers check about SIRS, milestone inspections and recertification?
Review the structural integrity reserve study, reserve balances and funding plan, milestone inspection findings under Florida Statutes §553.899, and the building's Miami-Dade or municipal recertification status. County guidance sets recertification at 30 years for inland and 25 years for qualifying coastal buildings, then every ten years. Also check adopted assessments, master insurance, budgets, litigation and 12-24 months of board minutes. Confirm with the lender early that the project is eligible, because personal preapproval does not settle that.
Will my property taxes be higher than the seller's after buying in Miami-Dade?
Often, yes. A sale can remove the seller's Save Our Homes assessment cap, and the property may be reassessed at market value for the following tax year. Estimate your own bill with the Miami-Dade Property Appraiser Tax Estimator based on your exemption eligibility, not the seller's bill. Recording costs are separate: documentary stamp tax on deeds is $0.60 per $100 of consideration, plus a $0.45 surtax for properties other than single-family residences, subject to applicable exemptions.
Do Miami MLS statistics include new construction and pre-construction sales?
Largely, no. Standard resale MLS statistics mostly exclude new-construction, pre-construction and condo-conversion transactions handled directly by developers, although some developer listings do appear. As a result, monthly Miami-Dade sales and inventory figures do not measure the full development market. The 16,535 building permits the Census Bureau reported for 2025 are construction context, not a count of units available to buy today.
- — Reading the Market
- — August Market Numbers
- — Geography and Data Dates
- — Sales Momentum in 2026
- — Prices by Property Type
- — Inventory and Supply
- — Two Different Market Conditions
- — Timing and Negotiating Leverage
- — Cash and Borrowing Costs
- — Luxury Segment Activity
- — Development and Resale Data
- — Condo Documents and Compliance
- — Flood and Ownership Costs
- — Taxes After a Purchase
- — Historical Prices in Context
- — Buyer Decision Checklist
- — Seller Pricing and Preparation
- — Indicators to Monitor Next
- — Property-Specific Analysis
- — Putting the Evidence Together